
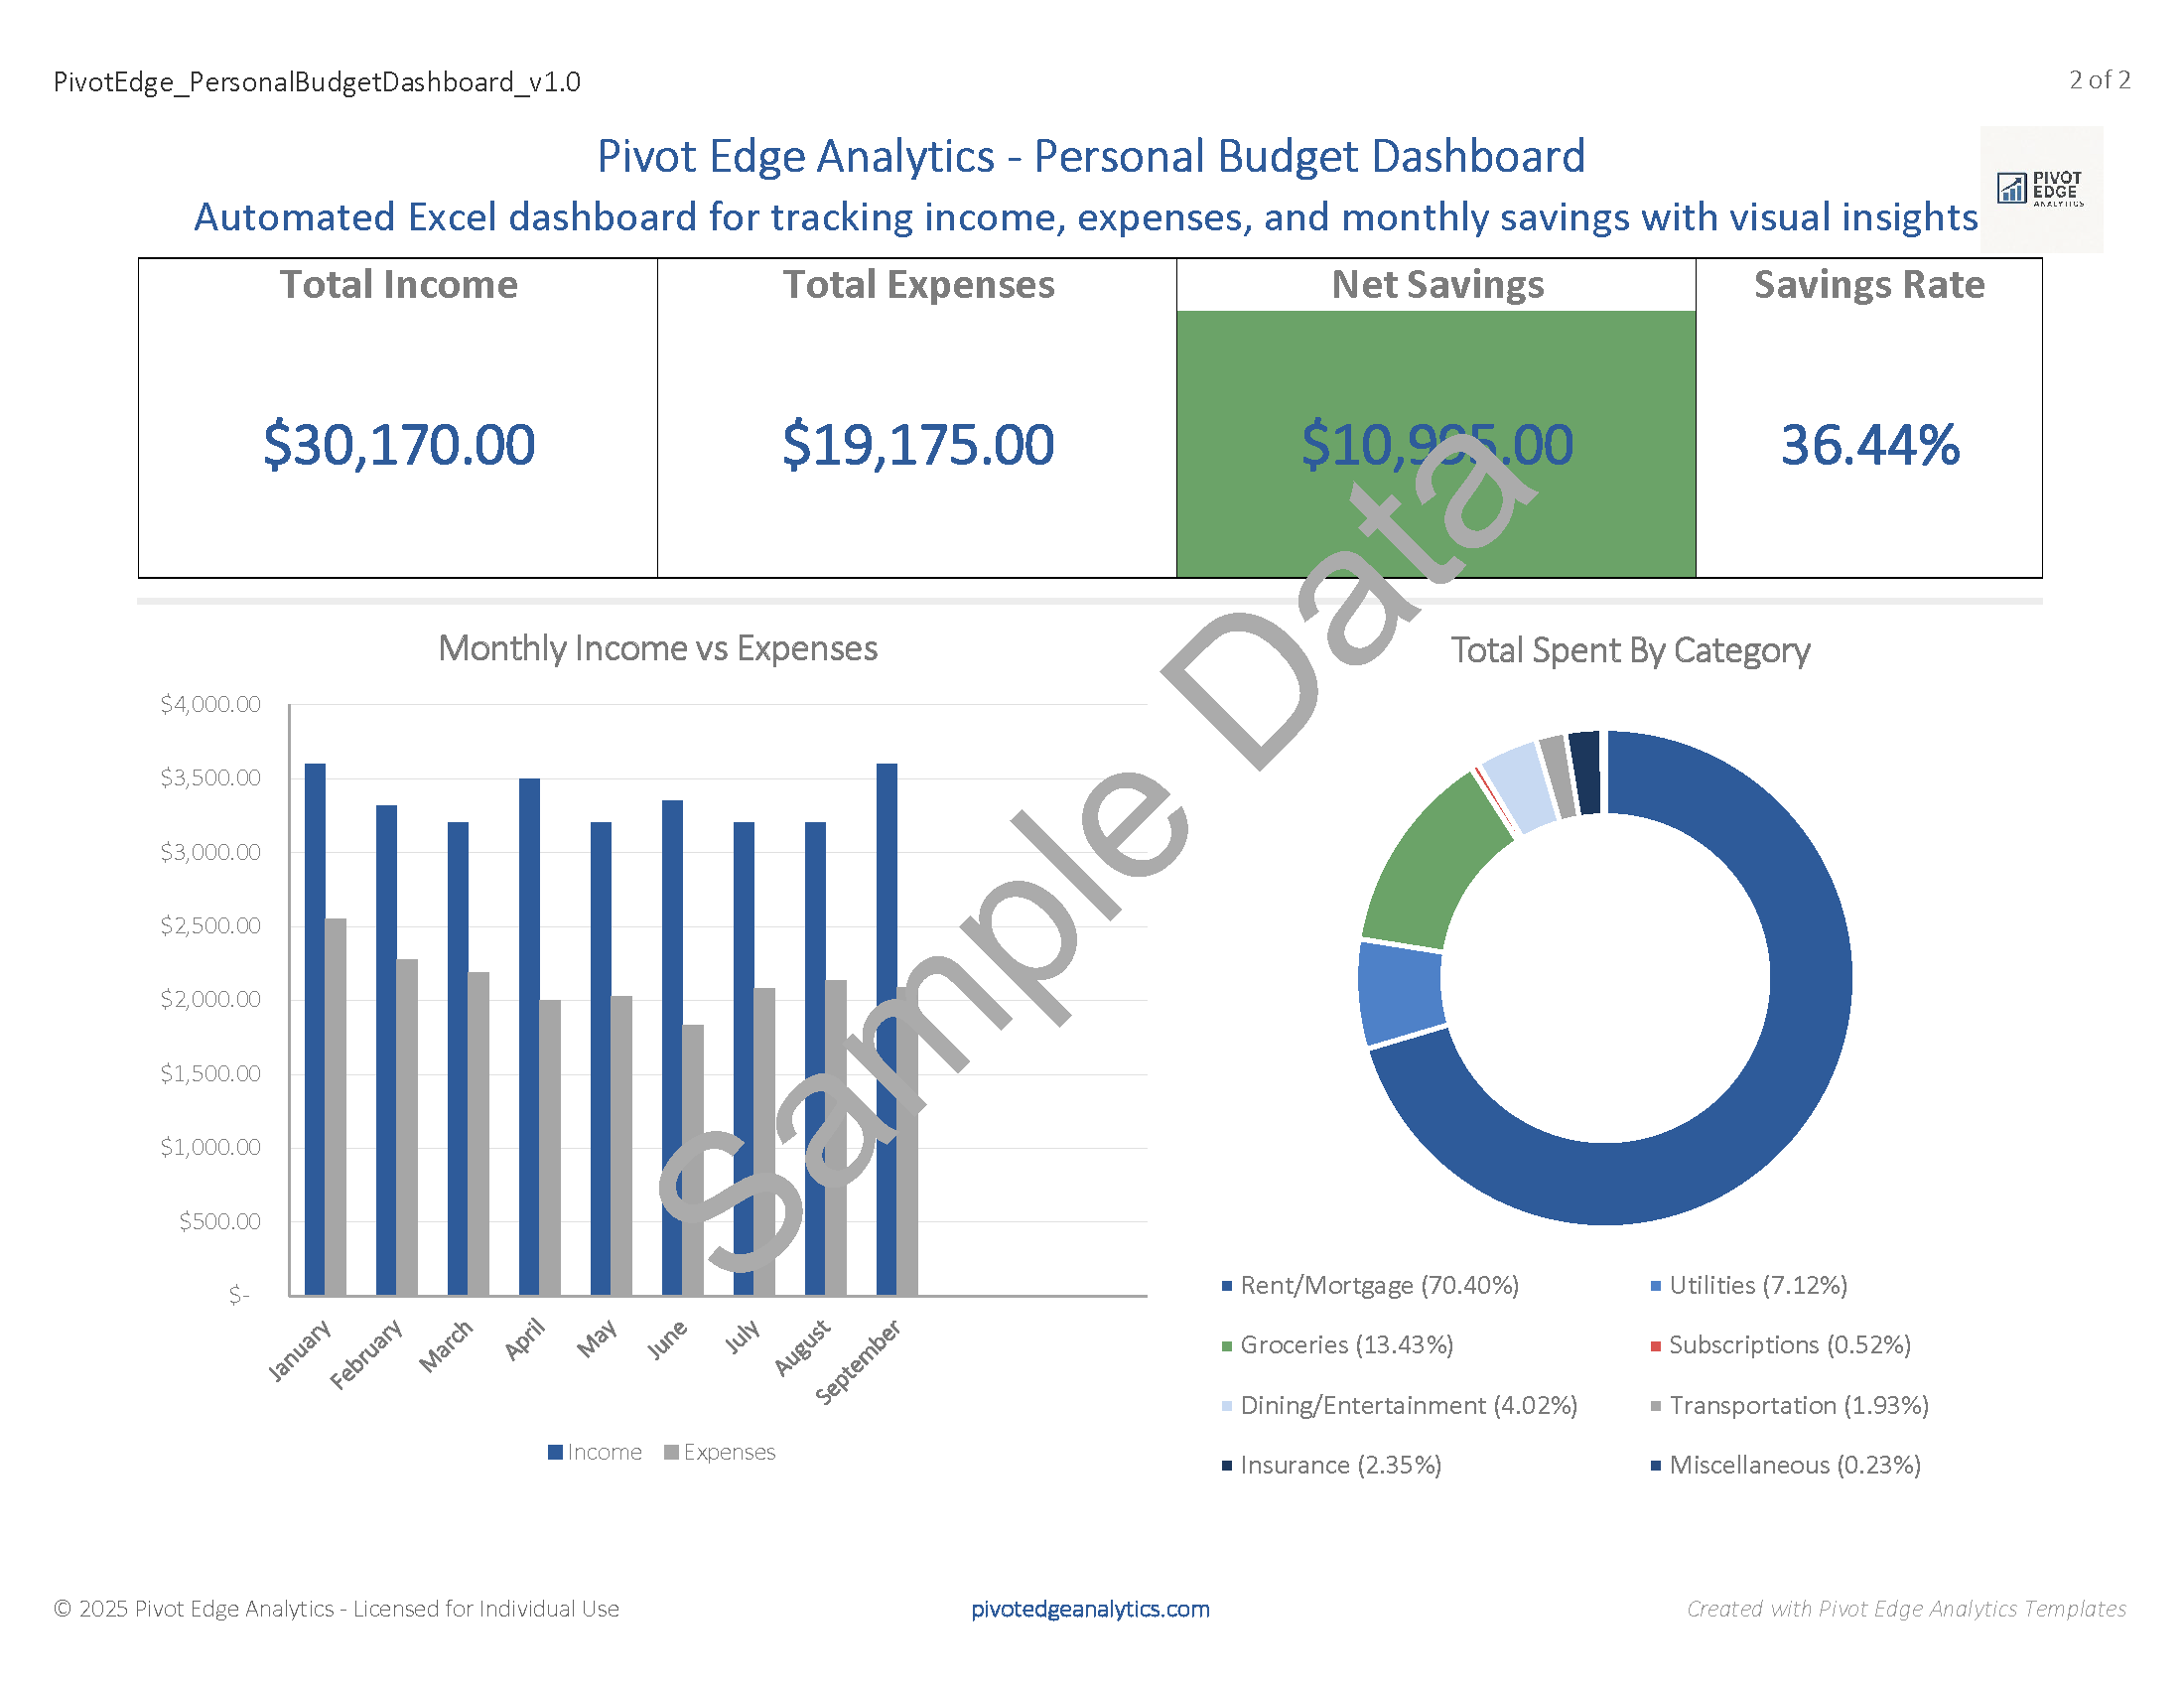
Know exactly where every dollar goes. This dashboard tracks income and expenses across every category — with automated charts, monthly summaries, and a savings rate calculation that updates in real time as you enter transactions.
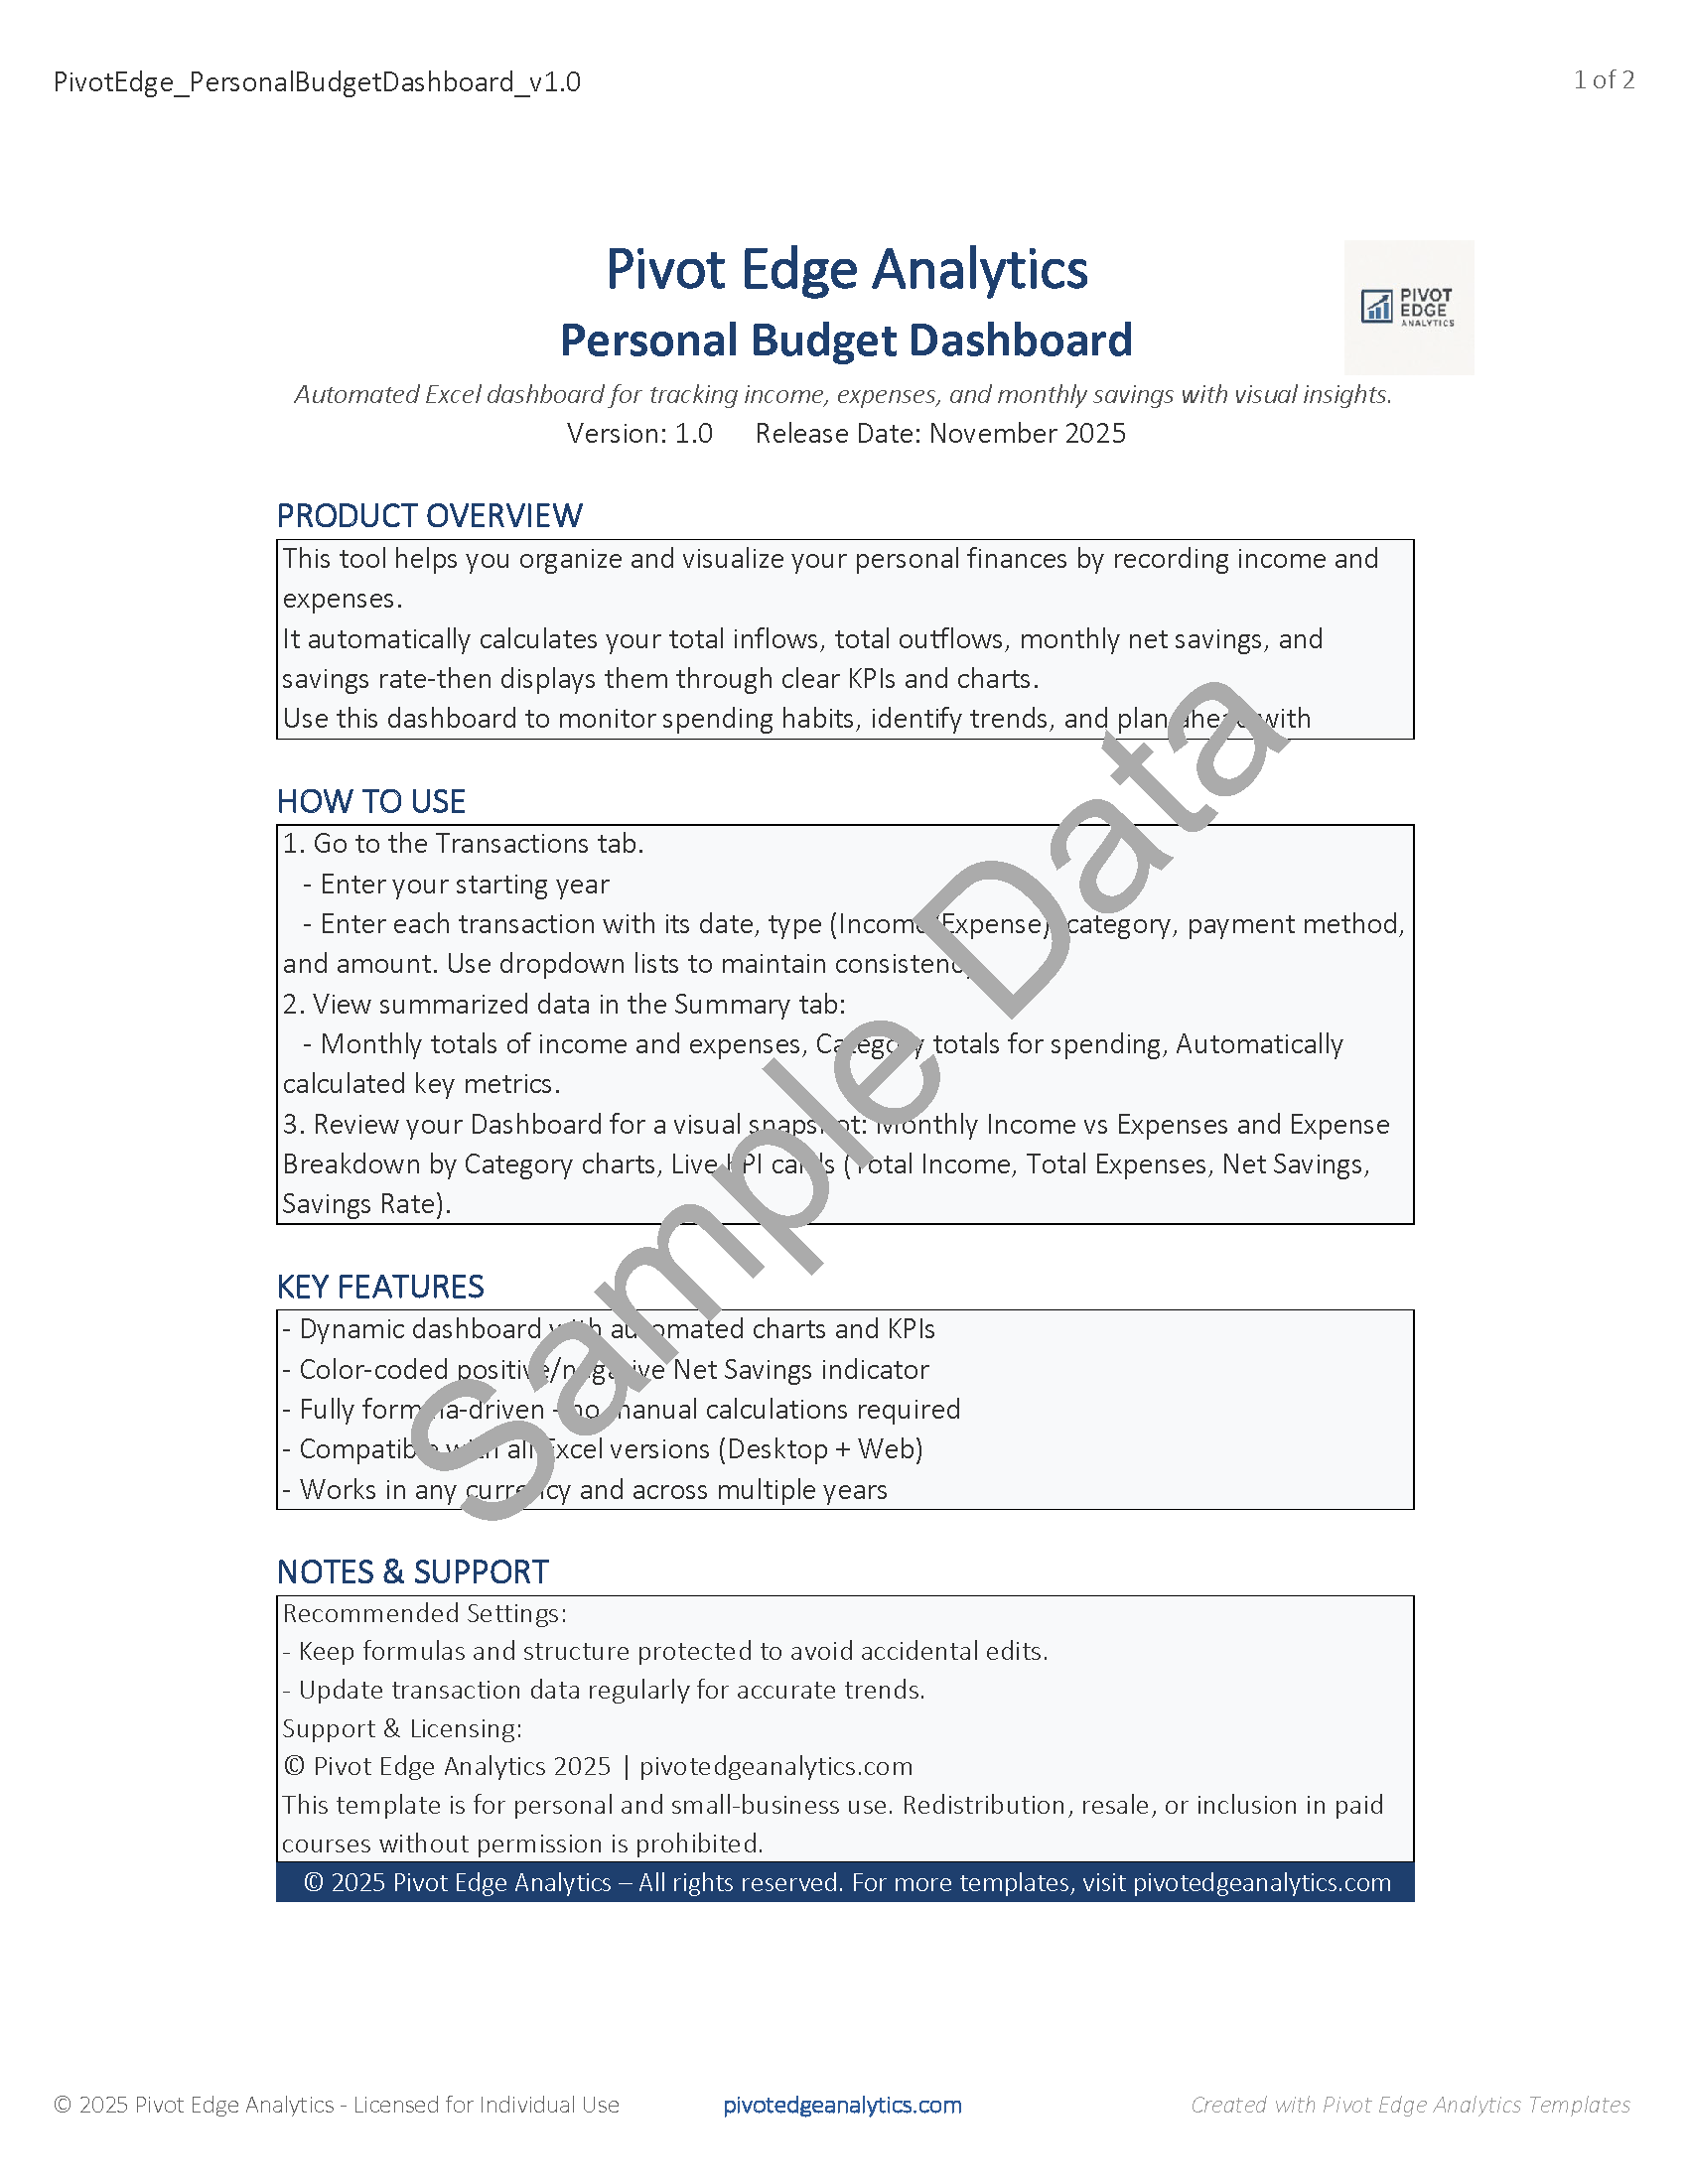
Enter each transaction with a date, type, category, and amount. The dashboard handles everything else — monthly totals, expense breakdowns, net savings, and visual trend charts.
What's included: transaction-based input, automated income vs. expense charts, category spending breakdown, net savings and savings rate metrics, multi-year support, and a color-coded savings indicator.
Know exactly where every dollar goes. This dashboard tracks income and expenses across every category — with automated charts, monthly summaries, and a savings rate calculation that updates in real time as you enter transactions.
Enter each transaction with a date, type, category, and amount. The dashboard handles everything else — monthly totals, expense breakdowns, net savings, and visual trend charts.
What's included: transaction-based input, automated income vs. expense charts, category spending breakdown, net savings and savings rate metrics, multi-year support, and a color-coded savings indicator.